Analytics
Where: Insights → Analytics
Insights → Analytics is the 30-day view: KPI cards for Revenue (30d), Orders (30d), and Avg order value, a “Daily revenue” line chart, and a “Top products (this month)” bar chart, with a “Refresh data” button. Numbers aggregate live — a freshly placed order shows immediately.
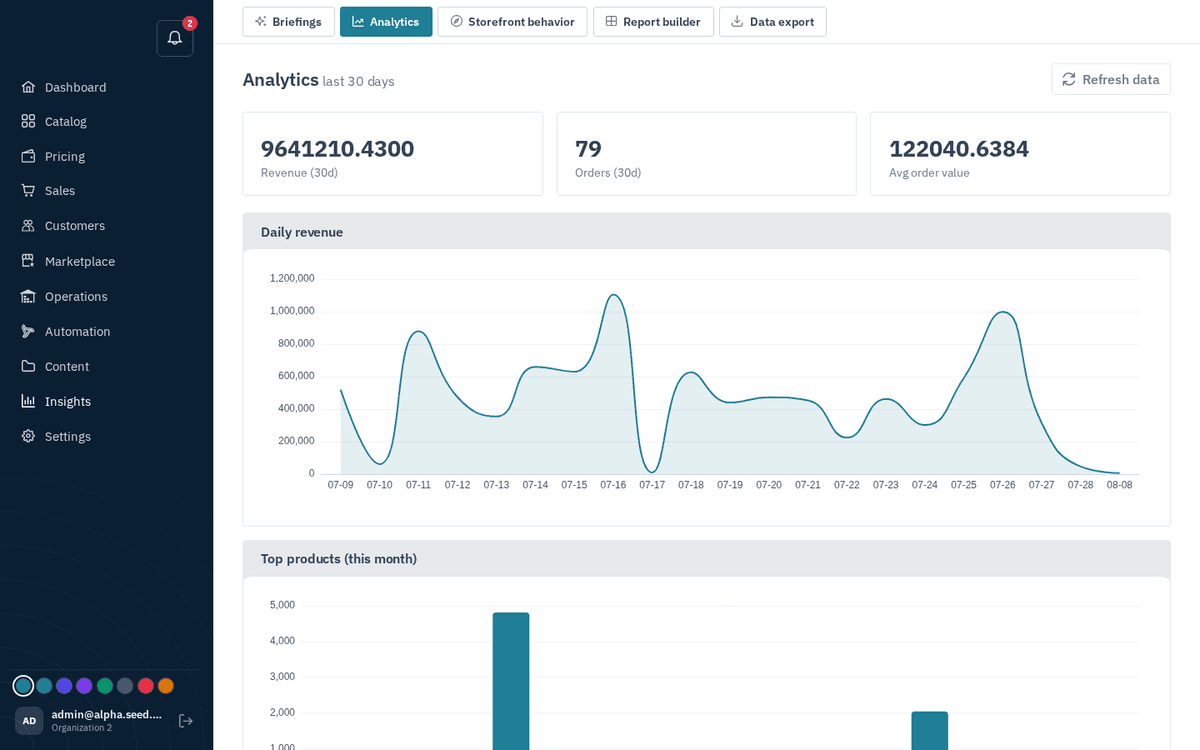
Insights → Analytics — 30-day KPIs, daily revenue and top products